
Reorganized Color Charts – Data, Color and Hidden Images
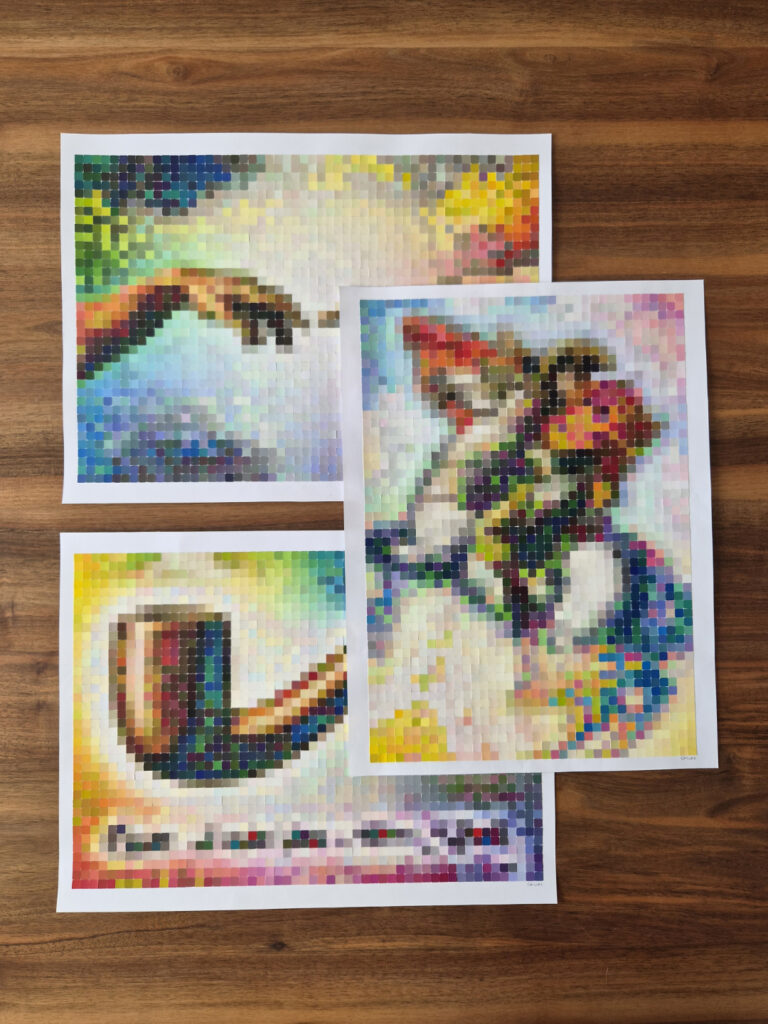
In this series, I transform commercial paint color charts into large-scale compositions that recreate iconic paintings. Rather than adding or removing colors, I reorganize every single color sample from an original paint chart to reveal an image that was already latent within its chromatic structure.
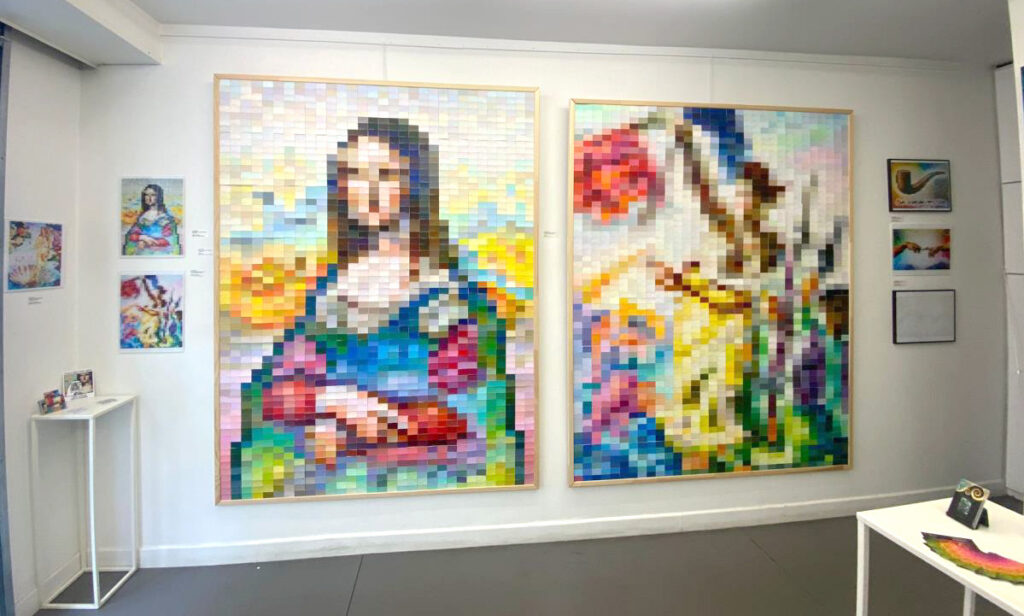
Each artwork is created usingone complete color chart containing nearly 2,000 individual paint swatches . Every swatch appears exactly once: no colors are duplicated, omitted, or altered. As a result, each composition contains the same number of colors and the exact same palette as every other work in the series—only their arrangement changes.
This process demonstrates how a collection of unique elements can generate entirely different images through organization alone. Every color, from the brightest yellow to the deepest violet, has an essential role to play. The paintings already existed as a potential within the color chart; my work simply makes that hidden image visible by revealing one of its countless possible configurations.
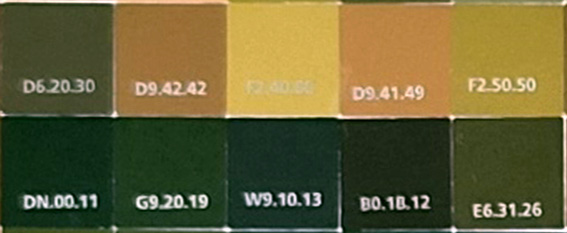
Viewed up close, each color swatch retains its original paint reference code , emphasizing that every image is also a form of encoded information. The works exist simultaneously as paintings, datasets, and systems of visual information.
By combining contemporary art, color theory, and data-driven composition, this series explores the relationship between aesthetics, digital encoding, and big data. It questions how the world is translated into information and how new meanings can emerge from reorganizing the data that already surrounds us.
Paint Color Chart Artworks :
- Mona Lisa
- Liberty Leading the People
- Narcissus
- The Birth of Venus
- The Treachery of Images (This Is Not a Pipe)
- Napoleon Crossing the Alps
Subscribe to my newsletter
Stay connected. Subscribe to receive news about my latest creations, exhibitions, and exclusive updates.